BK117: Temperature sensors

The fifteen temperature sensors are placed as follows:

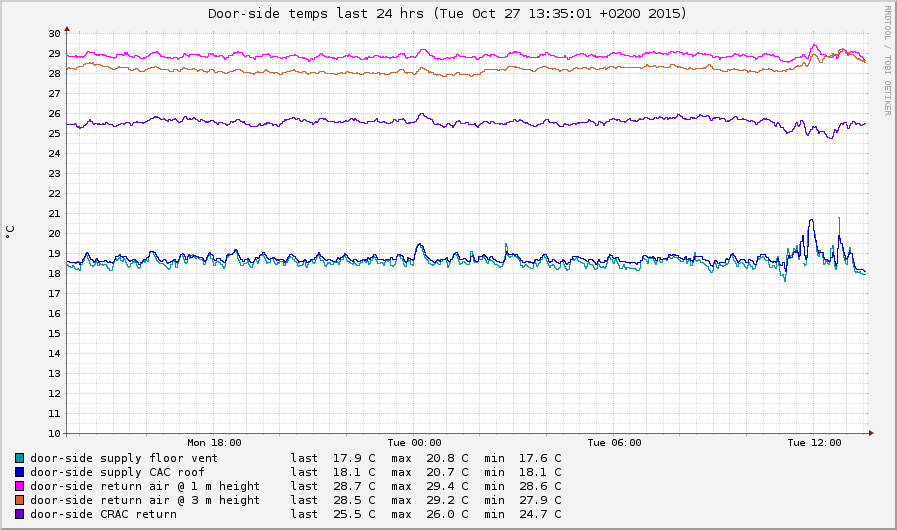
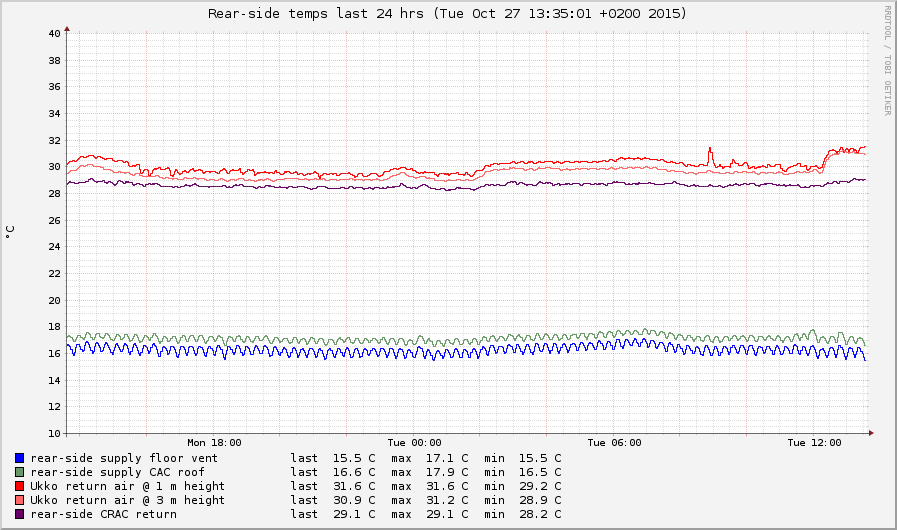
  1. BK117 is divided into two halves, DOOR and REAR
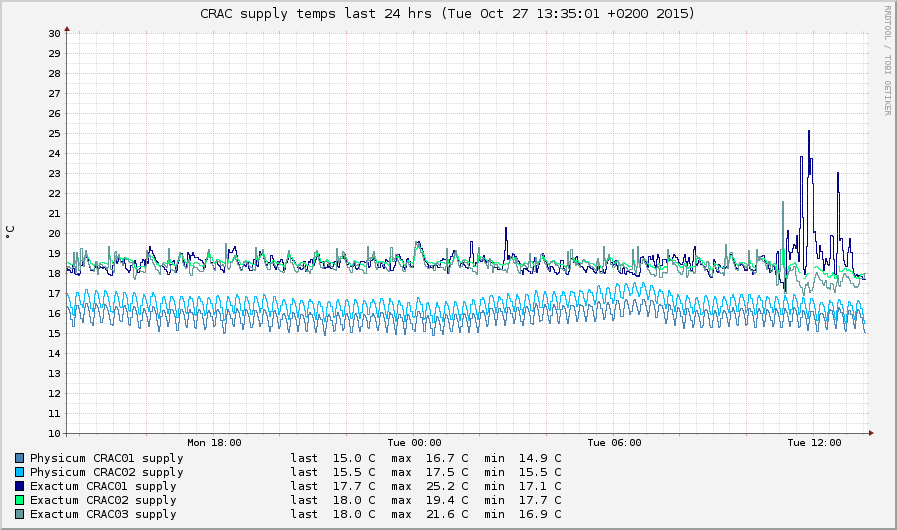
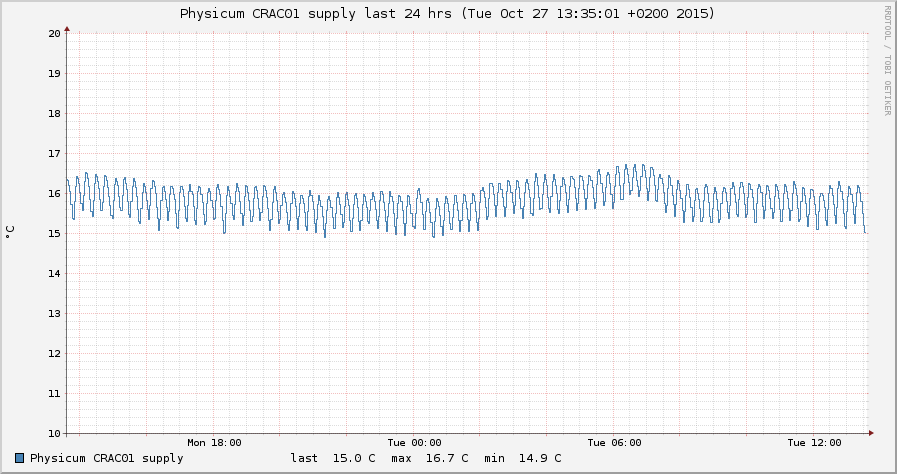
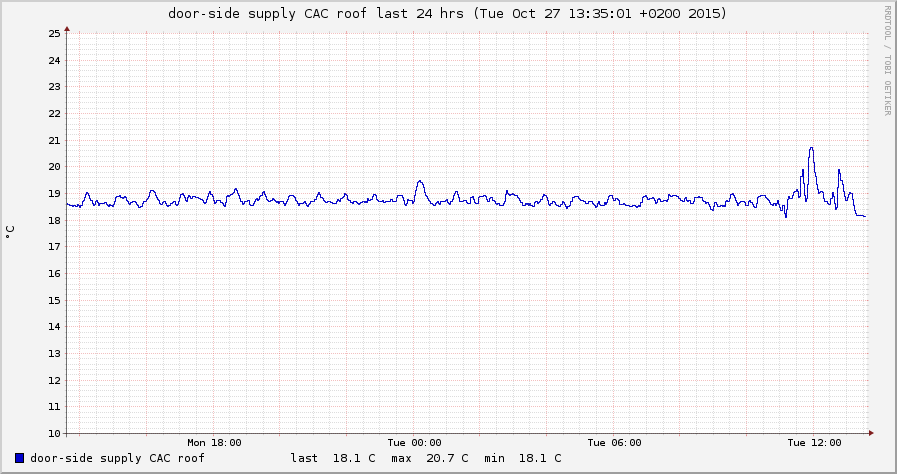
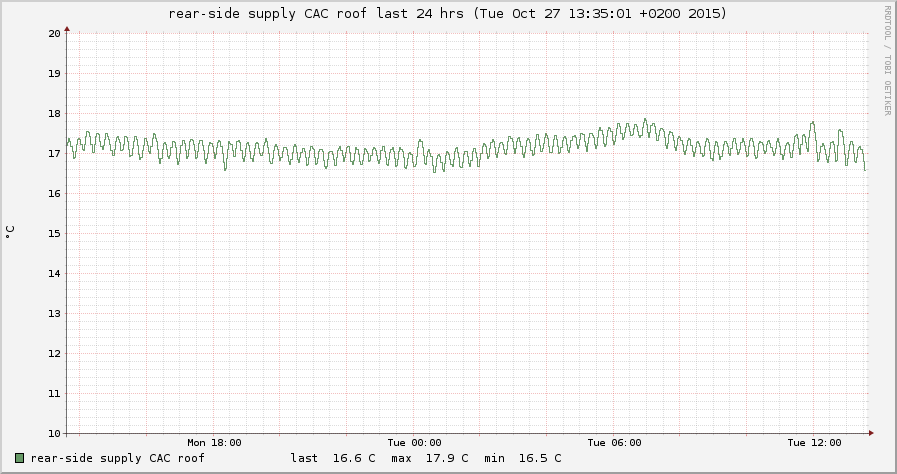
  2. Five sensors are placed near the supply fans of the CRACs
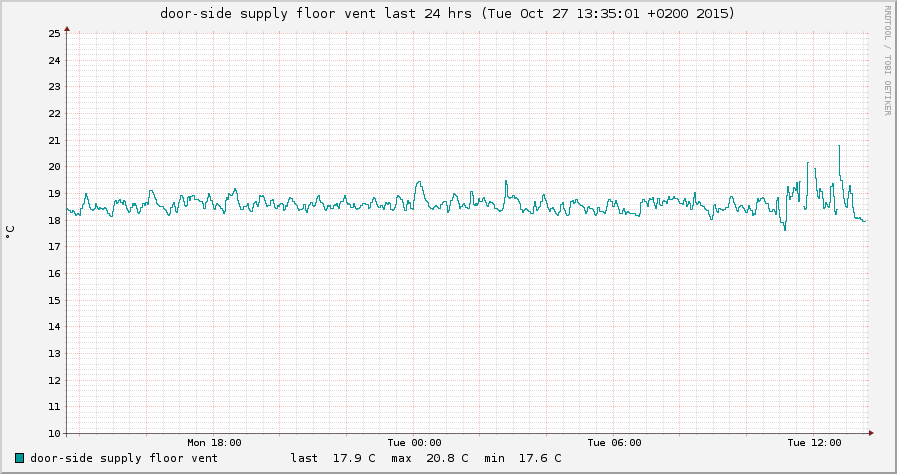
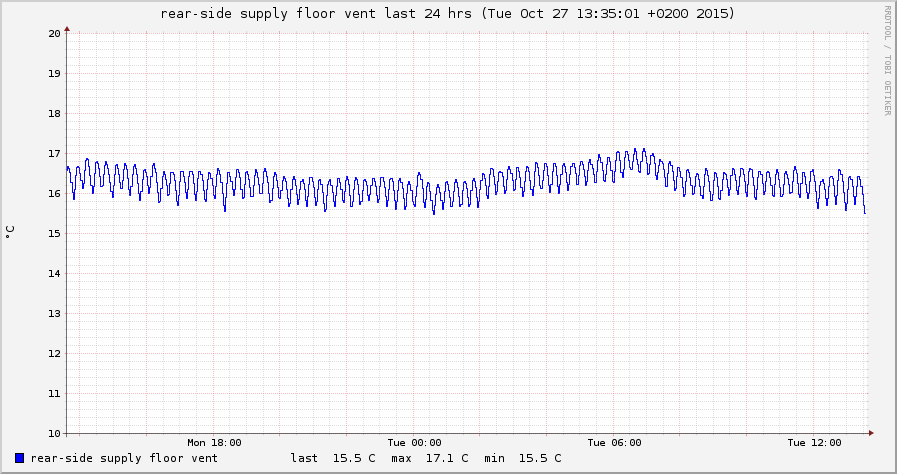
  3. Two sensors are placed under the cold aisle VENTS
  4. Two sensors are placed just below the cold aisle ROOF
  5. Two sensors are placed at the EXHAUSTs, near the far wall as seen from the CRACs
  6. Two sensors are placed over the EXHAUSTs, near the hot aisle ROOF
  7. So the air flows from Supply*CRAC to Supply*Vent to Supply*Roof to Return*Low to Return*High to Return*CRAC

Simple!

Combined graphs:

Graph
showing temperature data of CRAC supply air for the last 24 hrs Graph
showing temperature data of door-side half for the last 24 hrs Graph
showing temperature data of rear-side half for the last 24 hrs

Daily graphs (last 24 hrs):

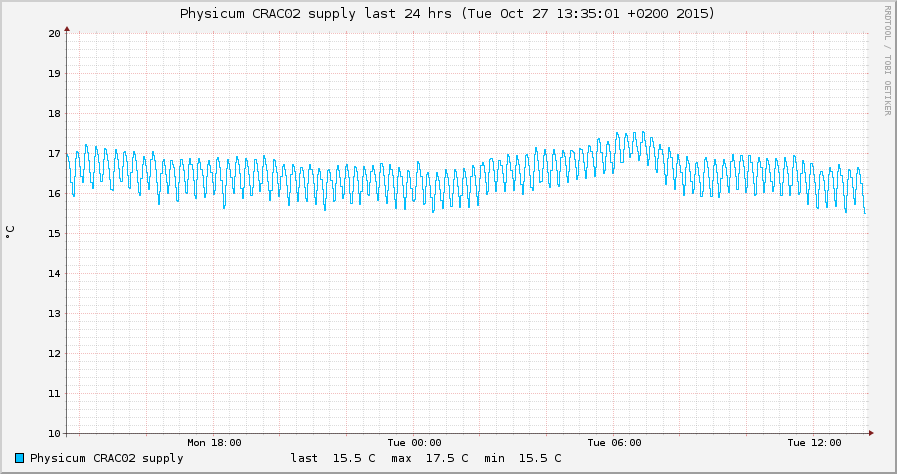
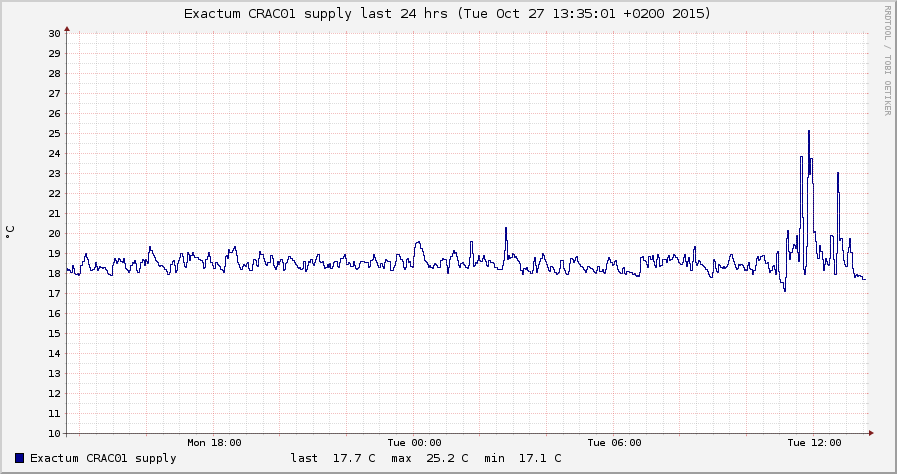
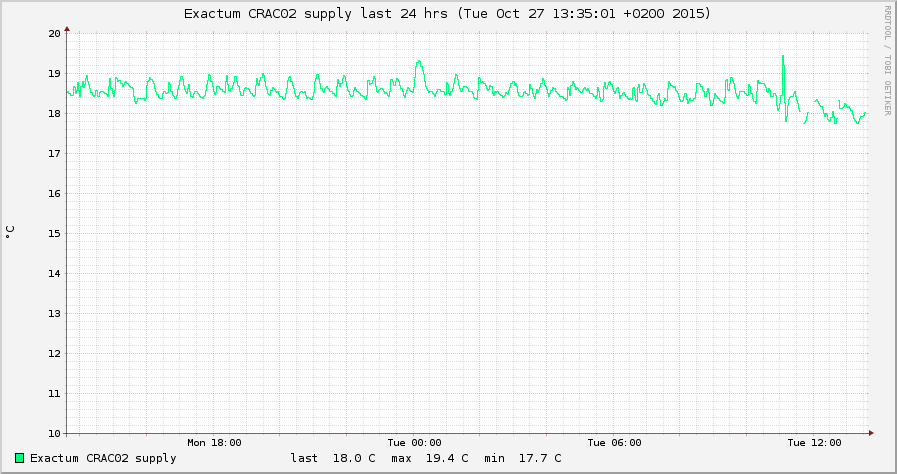
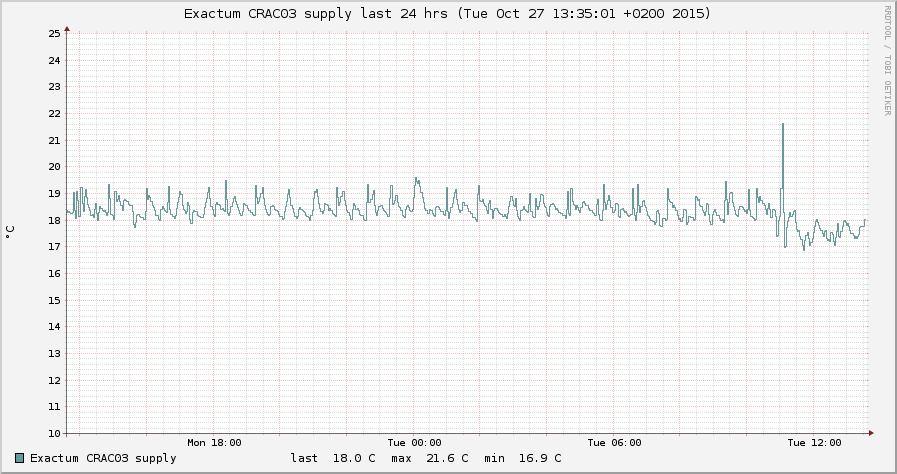
Under-floor supply air from CRAC:s
Graph showing temperature data for SupplyPhyCRAC1-last_24_hrs Graph showing temperature data for SupplyPhyCRAC2-last_24_hrs Graph showing temperature data for SupplyExaCRAC1-last_24_hrs Graph showing temperature data for SupplyExaCRAC2-last_24_hrs Graph showing temperature data for SupplyExaCRAC3-last_24_hrs
Intake air in Cold Aisle
Graph showing temperature data for SupplyDoorVent-last_24_hrs Graph showing temperature data for SupplyRearVent-last_24_hrs Graph showing temperature data for SupplyDoorRoof-last_24_hrs Graph showing temperature data for SupplyRearRoof-last_24_hrs  
Exhaust air above and behind racks
Graph showing temperature data for ReturnDoorLow-last_24_hrs Graph showing temperature data for ReturnRearLow-last_24_hrs Graph showing temperature data for ReturnDoorHigh-last_24_hrs Graph showing temperature data for ReturnRearHigh-last_24_hrs  
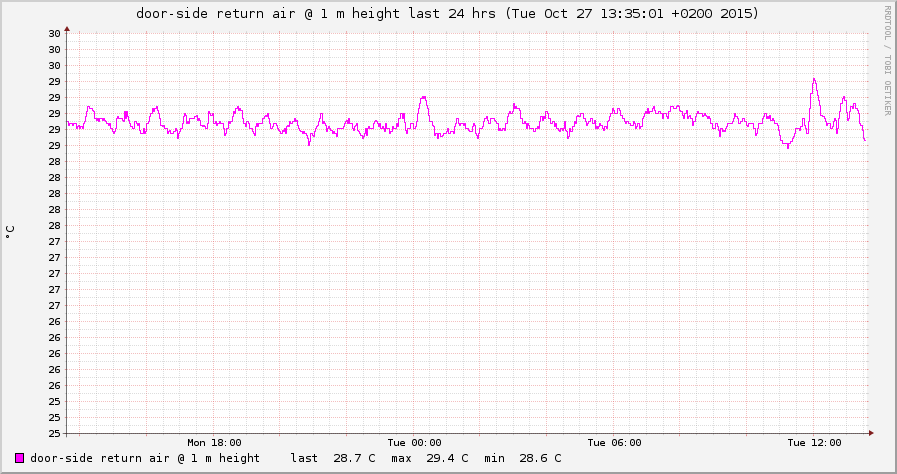
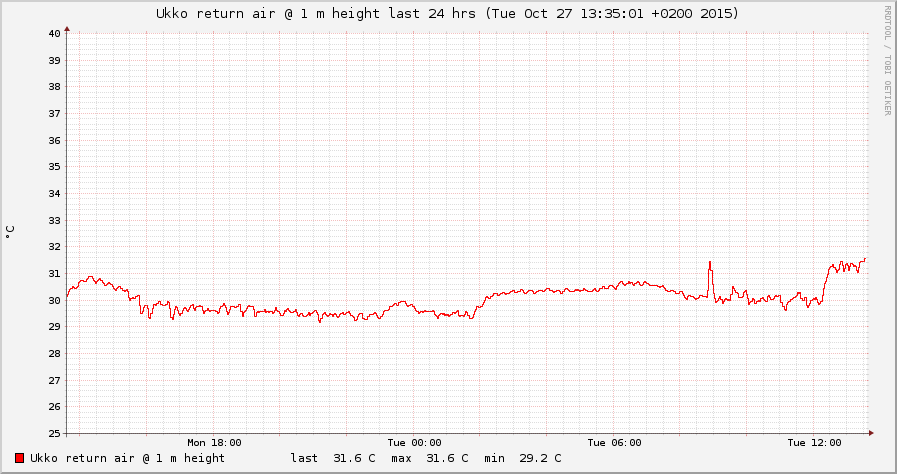
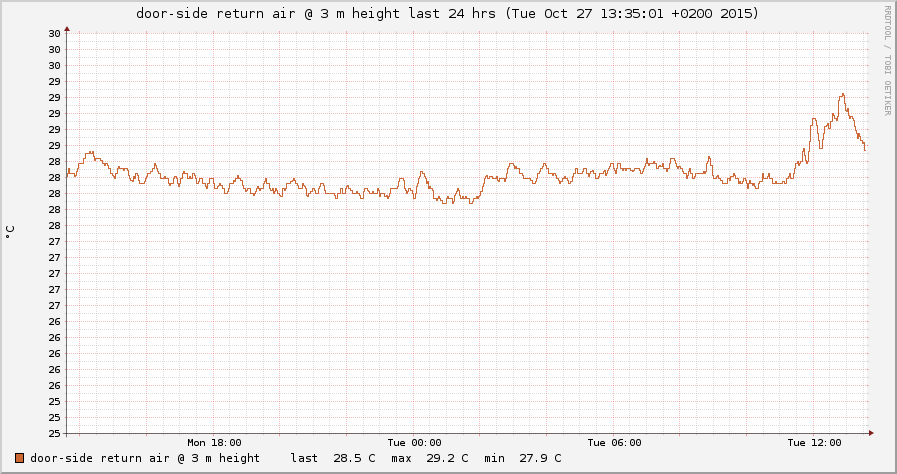
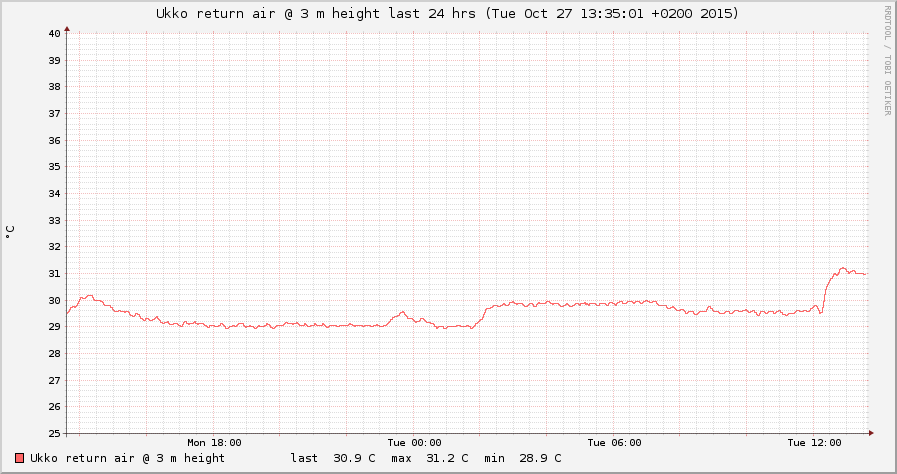
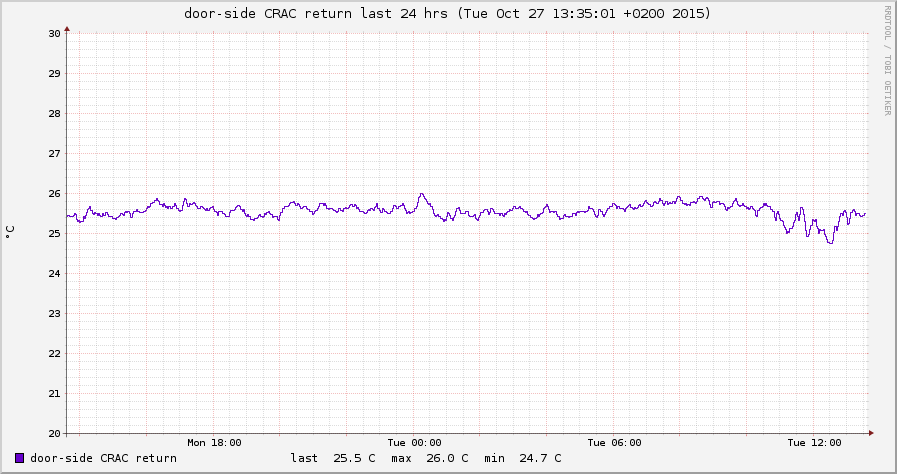
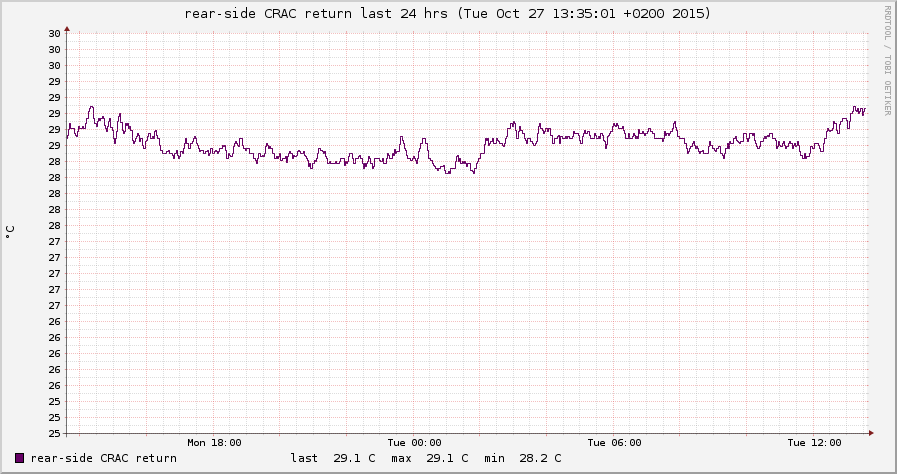
Return air above CRAC:s
Graph showing temperature data for ReturnDoorCRAC-last_24_hrs Graph showing temperature data for ReturnRearCRAC-last_24_hrs      

For more information, return to the Green ICT groups' home page.