Screenshots
This page contains screenshots of the two new visualizations of the viski project. Please note that the visualized data in these pictures is not actual data from any measurement.
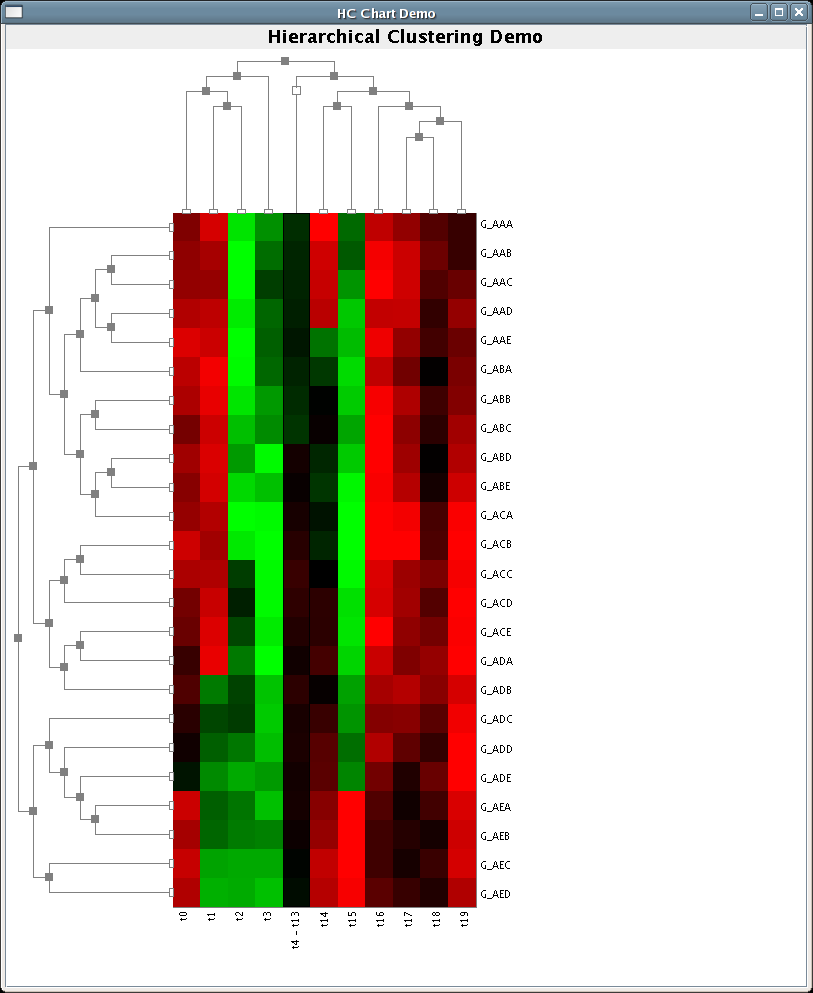
Hierarchical Clustering
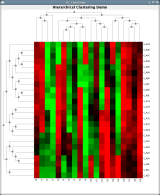
- Hierarchical clustering at the initial state.

- In our visualization, clusters can be closed in a way that only the average values of the data in the closed cluster are shown in the heat map. In this picture, the column cluster t4 ... t13 is closed.

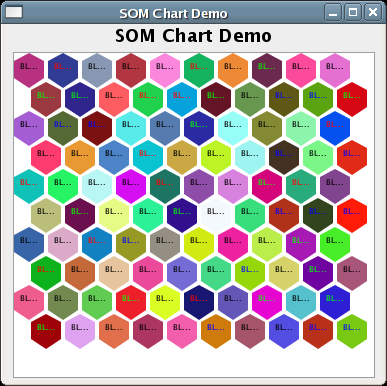
Self-organizing Map

- Visualization of a self-organizing map at the initial state.

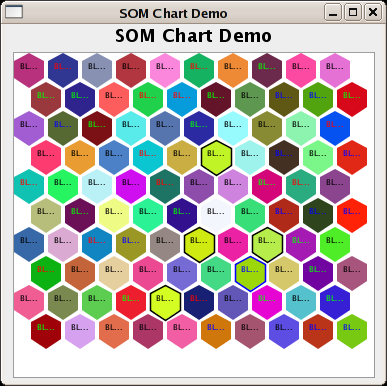
- It is possible to select cells in the map based on color distance.