Task 1: Counting motifs in a network (2 points)
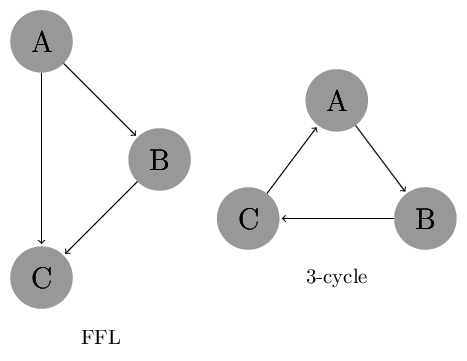
In this exercise set we will investigate two network motifs: Feed Forward Loop (FFL) and 3-cycle, which are shown in the image below.

The code below defines these as networkx graphs.
import networkx as nx
import matplotlib.pyplot as plt

# Define FFL by giving a list of edges
ffl = nx.DiGraph([('A','B'), ('B','C'), ('A','C')])
# Define 3-cycle by creating an empty graph and adding vertices and edges one by one
cycle = nx.DiGraph([('A','B'), ('B','C'), ('C','A')])

# Print the edges
print("FFL: ", ffl.edges())
print("3-cycle: ", cycle.edges())
Consider the network G as shown below:

The code below defines a network G. Write a function that counts the occurrences of the motifs FFL and 3-cycle. Use the frequency concept $\cal{F}_1$. Use the function to count the occurrences of FFL and 3-cycle in G.
Hint: Enumerate all paths of length two, i.e. ($A\rightarrow B, B \rightarrow C$), and check for the existence of the third edge of the motif. The DiGraph in networkx has methods successors and has_edge that you might find useful. Pay attention to the symmetries in the 3-cycle motif and make sure you report each occurrence of the motif only once.
# Define the graph
G = nx.DiGraph([(1,3),(2,1),(2,2),(2,3),(3,4),(4,2),(4,5),(4,6),(5,6)])

# Add your code here
Task 2: Motifs in the E. coli regulatory network (2 points)
In the previous exercise set (Task 2a) you wrote code that reads the E. coli regulatory network. Copy the code here.
# Your code
Using the function from the previous exercise, count the occurrences of FFL and 3-cycle in the E. coli reulatory network.
# Write your code here
Task 3: Statistical significance of motifs I (3 points)
a) Analytical solution
The lecture slides give a formula for the expected value and variance of the number of motif occurrences in ER networks. Using the formula compute these values for the two motifs, FFL and 3-cycle. Compare the number of occurrences of these motifs in the E. coli regulatory network to the expected number of occurrences in ER graphs by calculating the Z-score.
# Write your code here
b) Solution by creating an ensemble of graphs
The networkx library includes the function erdos_renyi_graph for generating ER graphs. Use it to generate an ensemble of 100 random directed graphs with $n$ vertices and edge probability equal to $m/n^2$ where $m$ is the number edges and $n$ the number of vertices in the E. coli regulatory network. For each graph in the ensemble compute the number of occurrences for the two motifs, FFL and 3-cycle. Calculate the average number of occurrences for the motifs and standard deviation of the number of occurrences. For each of the motifs plot the number of occurrences as a histogram.
Note: The networkx function does not add self loops to the ER graph. If you want to be perfect, you can add those yourself with the given probability. However, this will not affect the results of our analysis of the occurrence of these motifs because the motifs do not have self loops.
# Write your code here
c) Conclusions
Is the number of occurrences of the motifs in E. coli regulatory network statistically significant? Do the results you got in Task 3b coincide with the analytical solution from Task 3a?
Write your answer to the questions here.
Task 4: Statistical significance of motifs II (3 points)
ER graphs have a very different degree distribution as compared to the E. coli regulatory network. Therefore the result of the previous exercise might just be a consequence of having a particular degree distribution. In this exercise we will investigate if the number of occurrences of FFL and 3-cycle in the E. coli regulatory network is statistically significant as compared to random graphs with the same degree distribution.
a) Generating a random ensemble of graphs
First we will create random networks with the same degree distribution as the E. coli regulatory network. One way to do this is to start with the E. coli regulatory network and repeatedly choose two edges $a\rightarrow b$ and $c\rightarrow d$ and switch them by removing the original edges and inserting the edges $a\rightarrow d$ and $c\rightarrow b$. Note that the degrees of the vertices stay the same. Your first task is to write a function that takes as input a graph, creates a copy of it and performs $m$ random switches on it where $m$ is the number of edges in the graph. Create one randomly switched graph starting with the E. coli regulatory network using your new function and plot its degree distribution to make sure it looks the same as for the original graph.
# Write your code here
b) Occurrences of FFL and 3-cycle in the random graphs
Create 100 random graphs with the function you wrote. For each graph compute the number of occurrences for the two motifs, FFL and 3-cycle. Calculate the average number of occurrences for the motifs and standard deviation of the number of occurrences. For each of the motifs plot the number of occurrences as a histogram.
# Write your code here
c) Conclusions
Is the number of occurrences of the motifs in E. coli regulatory network statistically significant? Do the above results coincide with the results in Task 3?
Write your answer to the questions here.