The task is to find a fast sailing route in a given map from a given starting point to a waypoint and back. The route consists of line segments defined as a sequence of xy-coordinates. The cost of the route is the cost of the individual line segments plus an additional one minute penalty for each turn (no matter how big or small turn).
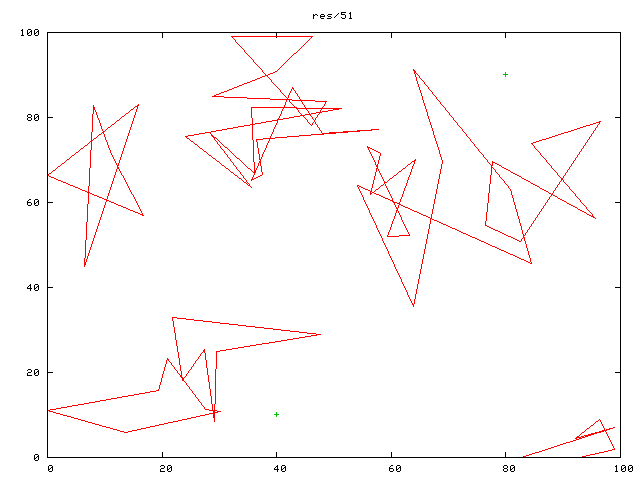
For example, on this map, the task is to sail from the point (40,10) to the point (80,90) and back without crossing any lines or borders of the map. The borders and the lines are defined in an ils-file, and the task is given in a task file. The length unit of a map is a sea mile.
The speed of the boat depends on the wind and the direction of sailing. The wind is assumed to blow from east to west. A polar diagram below shows the speeds of the boat to different directions of sailing with different wind speeds.
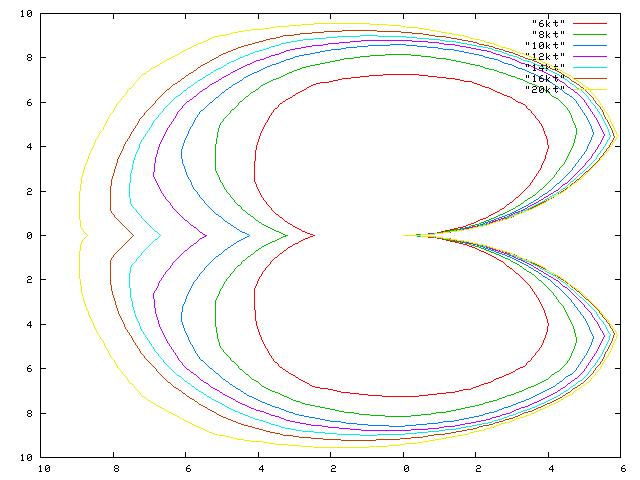
The polar diagram data can be found in kt-files (a polar diagram data for the wind speed 6kt (i.e, 6 sea miles per hour)).
All the files of the homework-2 can be found in directory HW2, that also contains a README-file. The directory can also be downloaded as a gzipped tar-file HW2.tgz, that can be extracted in the CS department's Linux system with a command tar xvfz HW2.tgz.
The procedures given below yield real numbers that cannot be exactly presented as floating point values. This is an inherent problem of floating point arithmetic. For example, here is an illustrative example in Python:
>>> print "%.60f" % float(1.2)
1.199999999999999955591079014993738383054733276367187500000000
that shows how 1.2 cannot be accurately presented in floating point, even if the 1.2 only has one decimal. This is because 1.2 does not have a nice presentation in binary.
Here is a short segment of code you may find useful in this project. The code was adapted from the information available at Nort Carolina State university CS department website for Graphics in Game Design course. The code snippet is written in python, but it should be easy to adapt to any language. The code checks whether the line from (x1,y1) to (x2,y2) intersects a line from (x3,y3) to (x4,y4). It has not been carefully tested, so please report the bugs:
def isect(x1,y1, x2,y2, x3,y3, x4,y4):

    den = (y4-y3)*(x2-x1) - (x4-x3)*(y2-y1)
    t1n = (x4-x3)*(y1-y3) - (y4-y3)*(x1-x3)
    t2n = (x2-x1)*(y1-y3) - (y2-y1)*(x1-x3)

    if den != 0: # LINES NOT PARALLEL
        t1 = t1n / den
        t2 = t2n / den
        return  0 <= t1 <= 1 and 0 <= t2 <= 1 # INTERSECTIONS WITHIN SEGMENTS
    else:  # LINES PARALLEL
        if (t1n==0.0 and t2n==0): # LINES COINCIDENT

            if x1 == x2:    # VERTICAL LINES
                sep = max(y1,y2) < min(y3,y4) or min(y1,y2) > max(y3,y4)
            else:
                sep = max(x1,x2) < min(x3,x4) or min(x1,x2) > max(x3,x4)

            return not sep

        else: # LINES NOT COINCIDENT
            return False
Assuming you are free to sail from (x1,y1) to (x2,y2), this set of procedures (in Python again) helps you to determine how long it takes. Please note that the details of the mathematical functions may differ in different programming languages. The code also assumes an array [0..360] of floating point numbers that denote the speed of the boat for angles 0, 1, ..., 360.
pi2 = 2*pi

def linelength(x1,y1, x2,y2):
    dx = x2-x1
    dy = y2-y1
    return sqrt(dx*dx + dy*dy) # same as hypot(dx,dy)

def line2angle(x1,y1, x2,y2):
    dx = x2-x1
    dy = y2-y1
    angle = atan2(dy,dx) # between -PI and PI
    if angle < 0:
        angle += pi2
    return 360 * angle / pi2 # same as degrees(angle)

def angle2speed(a, speeds):
    a0 = int(floor(a))
    a1 = int(ceil(a))
    f = a-a0
    return f*speeds[a1] + (1-f)*speeds[a0]

def line2time(x1,y1, x2,y2, speeds):
    angle = line2angle(x1,y1, x2,y2)
    speed = angle2speed(angle, speeds)
    length = linelength(x1,y1, x2,y2)

    if speed == 0:
        raise "Cannot sail into direction %f!" % angle

    return length / speed
Your task is to make a program named "sailor" that takes three files as input: the kt-file, the ils-file and the task-file. The program prints to standard output xy-coordinate pairs, one pair per line, that define the course of the sailing boat. If the program does not print out the course in one minute, it is considered failed (and it will be killed). Here is an example of a run:
./sailor 6kt 50.ils task_50
50 10
80 54.3213
50.0 80.0
5 70
60 80
80.0 41.2
50 10
You may visualize and test your route with a route2png.py program by giving it the kt-file, the ils-file, the task-file, your route file, and the name of the png-picture file to be produced, and then pipe the output of the route2png.py to the gnuplot. An example run that should produce a r50.png (which can be viewd with gthumb):
./sailor 6kt 50.ils task_50 > route_50
python ./route2png.py 6kt 50.ils task_50 route_50 r50.png | gnuplot
gthumb r50.png
You are supposed to return your work as a gzipped tar file containing (a directory hierarchy) with the source code of your sailor program and an executable runnable in the CS Linux system. To tar and gzip the directory mydir, go to the directory containing your directory, and use the command tar cvfz mydir. Send your work by an email to the lecturer and the assistant with a subject line HW 2.
Some avi-files of the solutions.