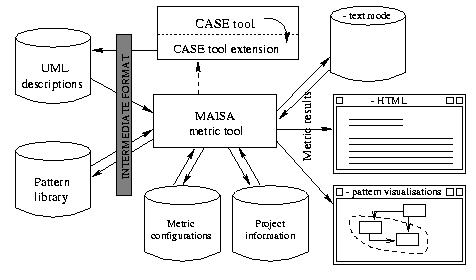
Figure 1: The overall architecture of the Maisa tool
Dept. of Computer Science, P.O. Box 26, 00014, University of Helsinki, Finland
Email: {lilli.nenonen, juha.gustafsson, jukka.paakki, inkeri.verkamo}@cs.Helsinki.FI
Fax: +358 9 19144441
The software architecture is the key artifact in software design, describing both the static structure and the dynamic behavior of the software. We present our metric tool Maisa and its method for automatically analyzing the quality of an architecture. The method can be used in an early phase of the software life cycle. Our approach is to measure object-oriented architectures from UML diagrams. We also derive quality estimates, based on recognized architectural patterns.
KeywordsObject-oriented software metrics, software architecture, metric tools, design patterns, anti-patterns, pattern recognition
A generally accepted principle in software engineering is that the quality of a software system should be assured in the early phases of its life cycle. Quality assurance methods are most effective when capturing the requirements and least effective when the system is already in full operational use: correcting an error encountered by the end-user is an order of magnitude more expensive than if it has been found already in the requirements analysis phase or at least in the software design phase. Another general principle is that you cannot control what you cannot measure [FeP1997]. The product of the development phase should be measurable in order to find and control its errors. Unfortunately, quality assurance methods with extensively automated support only apply in phases that are too late in the development life cycle to be really cost-effective. In order to be measurable, the product must have a formal representation. For this reason, the source code -- rather than products of the earlier development phases -- has been a natural target of measurement.
In the design phase it's still cost-effective to modify the software design, and the software can also be described precisely enough to be measurable [Pre1997]. The software design phase acts as a bridge between the informal, subjective user requirements and the formal presentation and implementation. Thus, it is a natural phase for effective quality assurance. The main technical result of the design phase is the software architecture, consisting of both dynamic and static views of the software. Object-orientation gives us formalisms to describe the architecture, for example the UML language [UML]. A major advantage of object-oriented notations is that the same description may cover the whole life cycle and is refined and itemized in every phase.
As an approach to design-level quality assurance, we present the UML-based software metric tool Maisa that is being developed in our research project, and discuss the main issues in its development. We identify an architecture (description) as a set of UML diagrams describing the same software system. The architecture can contain software design patterns that tell about the system's properties and that can be automatically recognized by Maisa [GaH1995]. Pattern recognition can be used as a metric among the others and also an asset to the traditional metrics.
We proceed as follows. In Chapter 2 general principles in measuring architecture descriptions are discussed. Chapter 3 presents the overall architecture of the Maisa metric tool. The metrics supported by the tool are discussed in Chapter 4. An example of using our tool is given in Chapter 5. Finally, conclusions and future work are discussed in Chapter 6.
Source code metrics are affected by the programming style of the programmer, as well as the programming language itself with its structures affects the metric results. When calculating the metrics from architectural descriptions, we achieve independency of languages and human factors [GuN1999, HiN1998]. Object-orientation has given us adequate formalisms to describe the architecture from various aspects already in the early phase of the software life cycle. UML is a de facto standard language of object-oriented software engineering. However, our idea of measuring is not bound to UML but it can also be applied to comparable languages. In fact, because UML is a visual language, the metric algorithms cannot analyze UML as it is. Instead, the UML diagrams must be transformed into an intermediate format [Mar1998, HiN1998]. The problem is that there is no generally (or commercially) supported textual format of UML. Our format for metric compilation is FAMIX, which has been used also in other metric projects [FAMIX]. Another format used in metric projects is Prolog.
The UML language consists of several diagram types, to describe different aspects of the the architecture [UML]. When identifying an architecture (description) as a set of UML descriptions, it can consist of diagrams of any type. Like the diagrams, the metrics express different properties of the architecture. Some metrics -- for example the depth of the inheritance tree -- are calculated from class diagrams, while others need different information of the system in order to produce sensible values. Class diagrams and collaboration diagrams describe the class and object structure of the software and message sequence charts, state-transition diagrams and activity diagrams present the dynamic behavior. Each diagram describes its own scope of the architecture [McG1999]. For example, a class diagram typically presents a package and state-transition diagrams express the internal behavior of a class. The diagram recommendations for each metric are discussed in Chapter 4.
For example, let's look at the UML description of a small personnel management program. The program consists of two packages of classes: Personnel_of_Firm and Sub_contractor. The Personnel_of_Firm package contains classes that model employers, employees, their behavior and departments of the firm. The departments use subcontractors that are modelled in the Sub_contractor package. The Sub_contractor class models the products of the subcontractors. We need two class diagrams, one for each package. The subcontractor is used by the department, thus the subcontractor class is shown also in the class diagram of the Personnel_of_Firm package (but none of the user personnel classes is shown in the class diagram of Sub_contractor package). To describe how the employees work, we need a state-transition diagram for the employee class. So, in total at least three diagrams are needed (they are shown in Figures 4, 5 and 6).
More than one diagram of the same type can belong to the same architecture description. Diagrams of some type can be unified before metric calculation and the resulting metric value can concern single diagrams or every diagram contained by the cluster. Class diagrams, collaboration diagrams and state-transition diagrams are this kind of diagram types. Considering class diagrams, classes with the same name are identified. For this reason, the package names must be present in the diagrams and the diagrams must be consistent (the package names in Figures 4, 5 and 6 are abbreviated because of the size of the Figures). Collaboration diagrams can be unified in the same way. Two state-transition diagrams can be unified if one of them is the specification of one state of the other, in which case they form a hierarchical Harel chart. All state charts belonging to the same hierarchy can be combined together in the same way. A sequence diagram describes one run time scenario of an algorithm and it is not a general description. Hence, sequence diagrams cannot be unified. It is possible to generalize several sequence diagrams into a state-transition diagram, but they cannot be unified into one sequence diagram. The metric values calculated from sequence diagrams are given only per diagram. In the previous example, a user department class calls the get_product method of the subcontractor class. Thus, the sub_contractor class is shown in both class diagrams, and the class diagrams can be unified (the unified class diagram is shown in Figure 7). We will return to this example in the next chapters.
The unification of the diagrams is based on identifying common elements them. Every element of the diagrams - class, method, state, transition and so on - have a unique name or an identification number. For example, an unique class name consists of package name and class name used inside the package, and an unequivocal state name consists of the unique class name and the state name. Thus, the elements can and must be identified both between the same kind of diagrams and between the diagrams of different types. For this reason, diagram names cannot be used as a part of the unique names. In the previous example, the FAMIX (or Prolog) file of the state transition diagram contains information of the class which the diagram represents.
It must be noted, that a metric tool based on an intermediate format, such as FAMIX or Prolog, does not care which type of diagram the internal form is transformed from (here we will not discuss in more detail how the program structures are described in Prolog [Mis1997]). Thus, the information of the diagram type has to be added to the diagram files so that the tool knows which diagrams to use. On the other hand, every diagram has a certain set of Prolog facts (or FAMIX structures) into which the diagram is transformed. Thus, all the facts can simply be put together and the metric calculation can be done from the resulting pool. Duplicate facts are ignored or deleted.
The Maisa metric tool can be used in the design phase of the software life cycle. Calculating metrics in such an early phase helps to choose the best design solutions. The tool is not dependent on any object-oriented programming language [HiN1998]. The Maisa tool is a dedicated metric program, not a CASE tool or a diagram drawing tool. It reads Prolog and FAMIX files and prints out the metric results. The Maisa tool does not itself generate transformations between the UML diagrams and the intermediate file formats and is thus independent of commercial CASE or UML tools and their internal representations. The FAMIX and Prolog files can be generated by an external case tool. We have extended the MetaEdit CASE tool to generate these formats, but the files can be produced by any means. The diagrams are presented as separate files and the unification of a project's UML diagrams is done within the Maisa tool.
Figure 1 presents the overall architecture of the Maisa metric tool. The tool is currently under development and the metrics supported at the time of writing this article are presented in the next chapters. The metric results are given in textual format. In the next phase of the project design pattern recognition algorithm and pattern based estimate algorithms are added to the tool, as well as support for producing the metric results in HTML format and possibly visualization of the recognized patterns. The pattern recognition and the pattern library are discussed in Chapter 6.
One of the basic concepts of the Maisa tool is a project, which is a set of UML diagrams (FAMIX and Prolog files, in practice) describing a software architecture. The other basic concept is a metric configuration, which means a set of measures, where each measure in turn consists of a set of metrics. A measure is a high-level property of the software architecture, while the metrics are low-level quantities that can be calculated from the architecture [FeP1997]. The difference between them is that a measure can rarely be calculated directly from the architecture, but it is represented by a set of metrics. Thus, the value of a measure is expressed by values of the set of metrics. For example, size of the software is a measure, while lines of code and number of classes are metrics. The user constructs a metric configuration and uses it when measuring a project. The tool is meant to be used to make series of measurements: either measuring different projects with the same metric configuration or measuring the same project with different metric configurations. Although the metrics calculated by the Maisa tool present the quality of the architecture and the software described by it, the tool is not bound to any particular quality system. The metric results are given according to the metric configuration, but no overall quality reading or value is given.
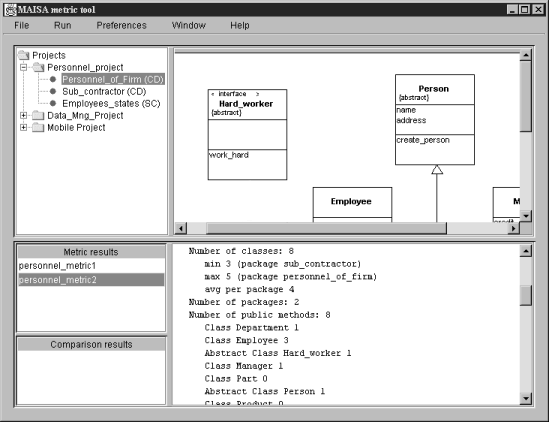
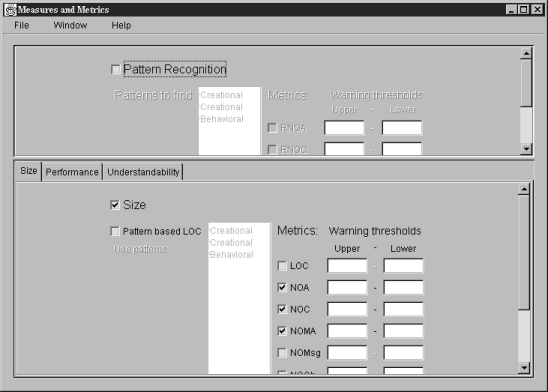
Figure 2 presents the main window of the Maisa tool. The example project loaded in the window is discussed in Chapter 5. On the top of the window the projects and their diagrams are shown. On the bottom the metric results are presented. There is a list of architecture comparison results for the future development. The metric configuration is defined in a separate window. Figure 3 presents the metric configuration window. The pattern mining metrics are shown there, although they are not yet in use. The user can give warning thresholds for any of the metrics. The metrics are classified in size, performance and understandability metrics. The metrics, emphasized on size at the time of writing this article, are discussed in Chapter 4.
The tasks of the Maisa tool can be divided into two parts: to measure properties of an architecture which results in accurate values and to predict properties of the to-be software system which results in estimated values. On the other hand, the metrics supported by the tool are both traditional software metrics applied to UML descriptions (instead of source code) and estimates based on design patterns. Traditional metrics give accurate values: numbers of certain elements of a (cluster of) diagram(s). Predicting future properties is based on analyzing the recognized design patterns. As mentioned in the previous chapter, the tool currently supports only traditional metrics.
Values of some metrics cumulate with the size of the measured architecture. This kind of metrics are numbers of certain elements in the diagram and size estimates of the software system. The value does not have to rise high but has a tendency to rise: the metric value does not rise if measuring, for example, the number of classes in multiple diagrams of the same package if only the same classes are present. But the cumulation is shown when, for example, every class diagram represents a different package used by the main program. The values of other metrics, for instance the McCabe complexity measure and the pattern coverage metrics, are relative and do not cumulate. It can be said that McCabe measure cumulates, because its value can rise if the state transition diagram is unified to create a larger one. However, if the value of McCabe measure rises, the cumulation is only a fractional part of how much NOS and NOT metrics tend to rise. The possible cumulation is to be taken into consideration when expressing the measurement results of the architecture description: are the values given per architecture or per diagram. The relative metrics are best suited to describe a project consisting of multiple diagrams. For instance the number of methods in class diagrams could be given as average values per class, and the number of transitions in the sequence diagrams could be given as the average per object.
Table 1 lists the metrics currently supported by the Maisa tool, all of them being traditional object-oriented software metrics. The table shows the metrics' abbreviations, shows from which diagrams a metric can be calculated and shows if the value is an estimation and if it cumulates.
| Metric | Abbreviation | Diagrams | Estimate? | Cumulates? |
|---|---|---|---|---|
| Number of messages | NOMSG | Sequence diagram | No | Yes |
| Number of objects | NOOB | Sequence diagram | No | Yes |
| Number of packages | NOP | Class diagram | No | Yes |
| Number of classes | NOC | Class diagram | No | Yes |
| Number of associations | NOA | Class diagram | No | Yes |
| Number of attributes | NOAt | Class diagram | No | Yes |
| Number of interfaces | NOI | Class diagram | No | Yes |
| Number of all methods | NOMA | Class diagram | No | Yes |
| Number of public methods | NOM | Class diagram | No | Yes |
| Depth of inheritance tree | DIT | Class diagram | No | No |
| Number of states | NOS | State-transition diagram | No | Yes |
| Number of transitions | NOT | State-transition diagram | No | Yes |
| Number of operations | NOOP | State-transition diagram | No | Yes |
| McCabe complexity measure | McCabe | State-transition diagram | No | No |
So far, the metrics of the Maisa tool concentrate on size. The only metric presenting complexity of the architecture is McCabe's complexity measure. Other typical complexity or coupling metrics tend to classify rather than give exact numbers. An example of using these metrics is given in the next chapter. The future development of the Maisa tool is discussed in Chapter 6.
Now let's look at the personnel project example, presented in Chapter 2 and shown in Figures 2 and 3. The example project Personnel_project is the personnel information of a company. It consists of three diagrams. Figure 4 is a class diagram Personnel_of_firm that models the personnel data. The subcontractors used by the firm are presented in class diagram Sub_contractor of Figure 5, which is referenced in diagram Personnel_of_firm. The subcontractor classes and the personnel classes are in different packages. The unification of the two class diagrams is presented in Figure 7. Figure 6 shows the state-transition diagram Employees_states that models the behavior of the employees. The same example is shown in Figures 2 and 3. Although not shown in Figures 4 and 7, the go_to_a_meeting method is private and all other methods shown in the class diagrams are public.
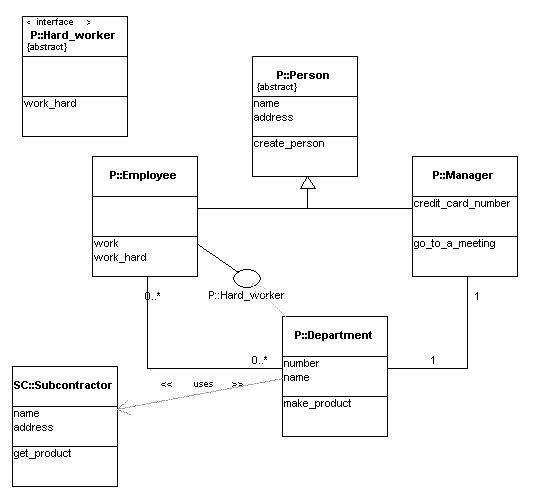
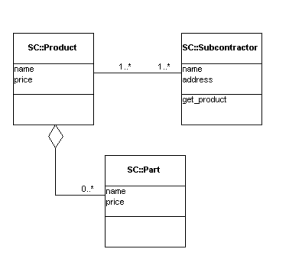
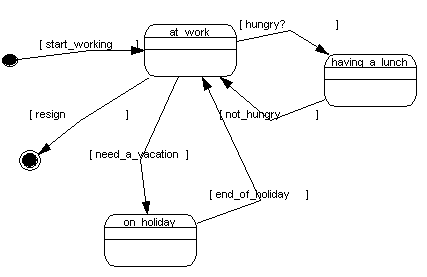
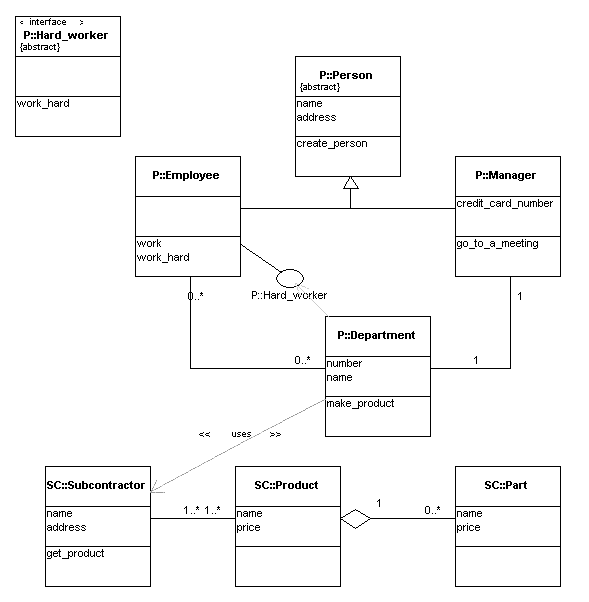
Table 2 presents the metric results for the Personnel_project. Numbers of methods, attributes and associations are given per project and per class. Also the number of transitions is given per state-transition diagram and per state. The metrics calculated from the unified class diagram and the state-transition diagram are given separately.
Class diagrams Personnel_of_Firm
               Sub_contractor
   Number of classes: 8
      min 3
      max 5
      avg per package 4
   Number of packages: 2
   Number of public methods: 8
      Class Department 1
      Class Employee 3
      Abstract Class Hard_worker 1
      Class Manager 1
      Class Part 0
      Abstract Class Person 1
      Class Product 0
      Class Subcontractor 1
      min 0
      max 3
      avg per class 0.75
   Number of all methods: 9
      Class Department 1
      Class Employee 3
      Abstract Class Hard_worker 1
      Class Manager 2
      Class Part 0
      Abstract Class Person 1
      Class Product 0
      Class Subcontractor 1
      min 0
      max 3
      avg per class 0.875
   Number of attributes: 15
      Class Department 2
      Class Employee 2
      Abstract Class Hard_worker 0
      Class Manager 3
|
      Class Part 2
      Abstract Class Person 2
      Class Product 2
      Class Subcontractor 2
      min 0
      max 3
      avg 1.875
   Number of associations: 3
      Class Department 2
      Class Employee 1
      Abstract Class Hard_worker 0
      Class Manager 1
      Class Part 0
      Abstract Class Person
      Class Product 1
      Class Subcontractor 1
      min 0
      max 2
      avg per class 0.75
   Number of generalizations: 2
   Number of interfaces: 1
   Depth of inheritance tree: 1

Statechart Employees_states
   Number of states: 5
   Number of transitions: 6
       State Start 1
       State at_work 3
       State having_a_lunch 1
       State on_holiday 1
       State Stop 0
       min 0
       max 3
       avg per state 1.2
   McCabe 3
|
We have presented some principles in measuring object-oriented software architectures described in UML. When calculating metrics from architectural descriptions, the measurement is independent of programming languages and the measurement, and the measurement can be done in an earlier phase, namely in the design phase of software life cycle. When metrics are calculated in such an early phase, the best design solutions can be chosen earlier and the possible unwanted properties and errors of the system can be corrected with an order of magnitude lower cost. Being a visual language, UML diagrams must be transformed into a textual intermediate format for calculating the metrics. There is no commonly supported textual formalism for UML. FAMIX and Prolog are two options. An architectural description consists of one or more UML diagrams. It can include more than one diagram of the same type. Different metrics can be calculated from different diagrams. Class diagrams, collaboration diagrams and state-transition diagrams can be unified, while sequence diagrams cannot. The metrics results calculated from a unified diagram cluster can be given per diagram or per architecture. The metric results calculated from sequence diagrams can be given only per diagram. Values of some metrics tend to cumulate according to the size of the measured architecture. The relative metrics do not cumulate.
We also presented our UML based metric tool Maisa. It calculates a set of traditional object-oriented software metrics. The Maisa tool is still under development. It will be extended with performance estimates, pattern recognition algorithms and pattern based prediction algorithms. The metrics supported by the tool will be classified into those measuring size, performance and understandability. Principles and problems concerning performance modeling and real-time properties of UML are discussed in other papers by our research group [GuN2000, VeG2000]. Run-time memory consumption will be estimated from class diagrams. The estimate is based on a techique proposed by Murphy and Saenko [MuS1998]. Pattern recognition will be implemented as a constraint satisfaction problem [Mis1997, PaK2000]. The algorithm uses Prolog as intermediate format, but it is faster than the Prolog interpreter. It must be noted, that the term "pattern" includes both "good" design patterns [GaH1995, Sch1995] and "bad" anti-patterns [Bro1998, CMG]. The anti-patterns are poor design solutions and tend to predict future problems. The design patterns predict good design. However, no design pattern is good for every situation. It depends on the context whether the pattern is suitable for the situation.
The pattern based metrics and estimates also include a relative value that express comprehensively the architecture is covered with patterns. The pattern coverage tells how reliable the pattern-based estimates really are, because only those classes that have a role in certain pattern, are taken into account in the estimate. The set of recognized patterns is a part of other measures. On the other hand, the pattern recognition is a metric among the others as it is. Understandability of the system can be measured as the pattern instances contained by it. The pattern instances help to understand how the system works, increase the granularity of the system and inprove reusability [Sch1995]. For metrics purposes pattern recognition is a method to predict future properties of the software. An interesting open question is how the pattern instances influence each other in the software system. If a software contains several instances of a pattern with certain effect, does the effect cumulate? If there are instances of patterns with opposite effects, do the effects compensate each other? Does the possible compensation or cumulation depend on the patterns? We will address these questions in the next phase of our project.
| [Bro1998] | William J. Brown, Raphael C. Malveau, William H. Brown, Hays W. III McCormick, Thomas J. Mowbray: Anti-Patterns: Refactoring Software, Architectures and Projects in Crisis , John Wiley & Sons, 1998. |
| [CMG] | Component Management Group, Anti-Pattern Page http://160.79.202.73/Resource/AntiPatterns/index.html |
| [FAMIX] | FAMIX format http://iamwww.unibe.ch/~famoos/FAMIX/ |
| [FeP1997] | Norman Fenton, Shari Lawrence Pfleeger: Software Metrics: A Rigorous and Practical Approach, International Thompson Computer Press, London, 1996. |
| [GaH1995] | Erich Gamma, Richard Helm, Ralph Johnson, John Vlissides: Design Patterns: Elements of Reusable Object-Oriented Software, Addison-Wesley 1995. |
| [GuN1999] | Juha Gustafsson, Lilli Nenonen: The state of art of object-oriented software measurement (in Finnish), University of Helsinki, Department of Computer Science, Report C-1999-52, 1999. |
| [GuN2000] | Juha Gustafsson, Lilli Nenonen, Jukka Paakki, A. Inkeri Verkamo: Performance Modeling in UML, University of Helsinki, Department of Computer Science, 2000. Submitted for publication. |
| [HiN1998] | Martin Hitz, Karin Neuhold: A Framework for Product Analysis, OOPSLA 1998 Workshop on Model Engineering, Methods and Tools Interaction with CDIF, 1998\\ http://www.metamodel.com/ooplsla98-cdif-workshop/hitz.txt |
| [Mar1998] | Michele Marchesi: OOA Metrics for the Unified Modeling Language, Proc. 2nd Euromicro Conf. on Software Maintenance and Reengineering, Florence, Italy, 1998, IEEE CS Press 1998, 67-73. |
| [McG1999] | John D. McGregor: Making Diagrams Useful, Not Archival, Journal of Object-Oriented Programming (JOOP), Vol. 12 No. 2, May 1999, 24-28. |
| [Mis1997] | Pauli Misikangas: Recognizing Design Patterns from Object-Oriented Programs (in Finnish), Master's Thesis, University of Helsinki, Department of Computer Science, Report C-1998-1, 1997. |
| [MuS1998] | Gail C. Murphy, Ekaterina Saenko: Predicting Memory Use from a Class Diagram using Dynamic Information, proc. First International Workshop on Software and Performance, ACM, 1998, 145-151. |
| [PaK2000] | Jukka Paakki, Anssi Karhinen, Juha Gustafsson, Lilli Nenonen, A. Inkeri Verkamo: Software Metrics by Architectural Pattern Mining, To appear in Int. Conf. on Software: Theory and Practice (16th IFIP World Computer Congress), Beijing, China, August 2000. |
| [Pre1997] | Roger Pressman: Software Engineering - A Practioner's Approach, 4th ed. McGraw-Hill, 1997. |
| [Sch1995] | Douglas Schmidt: Using Design Patterns to Develop Reusable Object-Oriented Communication Software, Comm. ACM, vol. 38, no. 10, Oct. 1995, 95-74. |
| [UML] | UMLanguage Resource Center:
Unified Modeling Language, Standard Software Notation http://www.rational.com/uml/index.jtmpl |
| [VeG2000] | A. Inkeri Verkamo, Juha Gustafsson, Lilli Nenonen, Jukka Paakki: Design Patterns in Performance Prediction, University of Helsinki, Department of Computer Science, 2000. Submitted for publication. |