Data Sets
Rules
Example
Submission
Results
Credits
 Discussion
Example: Data Set #2: Parzival
As an illustration, we describe results obtained using a simple hierarchical clustering algorithm for Data Set #2: Parzival (see Data). We also give the correct solution for this task.
Hierarchical Clustering
As a preprocessing step, the 16 texts were organized in an aligned table of words (each column gives a text with one word per row; the file can be directly imported to spreadsheet programs such as Calc or Excel).
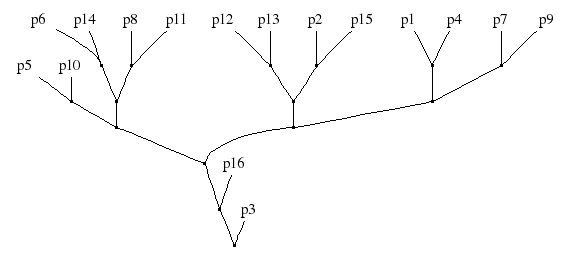
From the table of words, a 16 x 16 matrix of pair-wise word-agreement fractions Ai,j was obtained by counting for each pair the number of identical words divided by the total word count. The hierarchy of Figure 1 is a result of agglomerative hierarchical clustering (with the maximum distance/complete linkage criterion), under the distance (1-Ai,j).
Figure 1: Hierarchical clustering applied to Data set #2.
Correct Solution
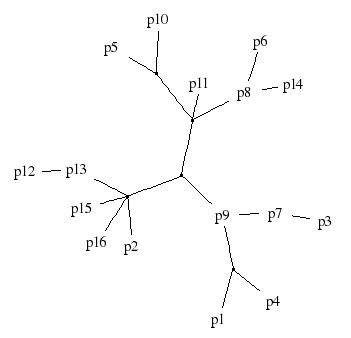
The manuscripts were created by volunteer scribes in an experiment described in (Spencer, Davidson, Barbrook & Howe, "Phylogenetics of artificial manuscripts", J. Theor. Biol. 227:503-511, 2004, doi:10.1016/j.jtbi.2003.11.022). Some of the manuscripts (LM, DL, ND, SD, KH) in the original data-set were omitted, and the remaining 16 variants were renamed as p1, ..., p16. The correct solution (Figure 1 in the paper) is given in Figure 2 below.
Figure 2: The correct solution for Data set #2. The original text is in the (unobserved) center node adjacent to p9.
Scoring
The scoring function is (distant) relative of the "triples distance" (Critchlow, Pearl & Qian, "The triples distance for rooted bifurcating phylogenetic trees", Syst. Biol. 45(3):323-334, 1986, abstract, fulltext JSTOR). Given an arbitrary (not necessarily tree-shaped) true graph, the score of an arbitrary estimated graph is the average of
over all distinct triplets of observed nodes A,B,C, where d(A,B) is the distance between nodes A and B in the true graph, and d'(A,B) is the same distance in the estimated graph. (The value of sign equals -1 is the argument is negative, 1 if the argument is positive, and zero if the argument is zero. The function abs gives the absolute value.) In words, the gain is one unit if the signs of the distance differences agree in the two graphs, half units if one (and only one) of the signs is zero, and zero units if the two signs are (1,-1) or (-1,1).
uB,C | A = 1 – abs[sign(d(A,B)–d(A,C)) – sign(d'(A,B)–d'(A,b))] / 2, For instance, in the graphs of Figures 1 & 2, we have up4,p7 | p1 = 1 since d(p1,p4)=2 < d(p1,p7)=3 and d'(p1,p4)=2 < d'(p1,p7)=4; but up4,p9 | p1 = 0.5 since d(p1,p4)=2 = d(p1,p9) and d'(p1,p4)=2 < d'(p1,p9)=4.
The score is reported in percentages: the score of the correct graph is 100 %, etc.
The reason for using a non-standard distance measure is that the used measure has to be applicable to arbitrary (non-tree shaped) graphs. Note that the distances in the graphs are taken to be simply the number of edges along the shortest path. All edge-length information is ignored. (Should we be doing this?
Go to Discussion.)
The score of the graph in Figure 1 is 72.6 %. (Corrected on April 11.)
You can find a C program to calculate the distance here: Download. (The parsing of the input graph is presently in a terrible shape, and will not work for all files conforming to the DOT format.)
Update: A scoring function which accepts graphs in adjacency matrix format is now available: tripled.py (in Python). The format is described on the Submission page (item 3). In addition to the score described above, the python version also computes a similar score for the orientation.

